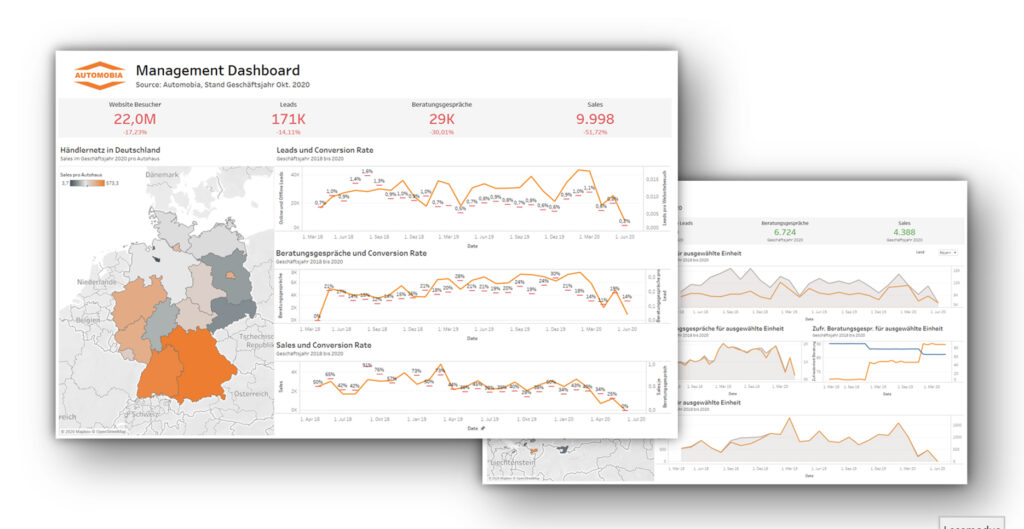
Sales Funnel and Marketing Spendings Management
Within the scope of various business intelligence projects, MSR has dealt with generating insights from data, deriving KPIs relevant to management, depicting these in the form of dashboards and thus transferring them into daily use. We are convinced that fact-based management is superior to a purely intuitive approach and makes an enormous contribution to success. Not only because it leads to a better understanding of the customer and to doing the right thing accordingly. But also because it allows companies to create a currency that creates a common focus on a goal across all levels of the company. A typical project is outlined below using the example of “Sales Funnel and Marketing Spendings Management”.
Appropriate steering instruments make you more competitive
In many industries, decentralised units are supported with marketing budgets to promote the manufacturer’s products locally or regionally. This also applies to the automotive industry. But often a suitable instrument for measuring success has not yet been installed. There are many reasons for this: inefficient reporting lines, data silos, poor data quality and different definitions of various KPIs. A lot of potential is wasted here. Without a suitable control instrument, marketing expenditure cannot be critically evaluated.
At the beginning is the inventory
First of all, the topic of marketing effectiveness must be operationalised. Roughly summarised, the data of the sales funnel, the respective spendings and the sales performance are relevant. The following data is usually available at the level of the individual units:
Sales Funnel & Distribution:
- Number of website visitors
- Number of online and offline leads
- Number of showroom visitors
- Number of Test Drives
- Number of Sales
- Conversion Rates of KPIs
- Turnover
- New customers
Marketing Spendings:
- Spendings in total
- Spendings by different channels (print, TV, online, OoH etc.)
The first step should be to take stock: Is this data really already available and how is it consolidated so far? Here it is important to talk to the operational units to find out whether there are already clearly defined processes and whether everyone involved has the same understanding of the respective KPIs.
Afterwards, the data should be merged once manually. This enables the first correlation analyses. Are the figures plausible? Are there differences depending on the unit? The first functional mock-ups can then be built on the basis of this data. This procedure saves important resources. With the templates, coordination can be sought with the individual units. This way, all relevant stakeholders are already involved in the later implementation and transfer of the concept to the production environment.
Data quality can be significantly increased through process optimisation
It often becomes clear in this phase that not all units have the same understanding of the various KPIs. Here it is important to coordinate the content and define all KPIs accordingly. Where figures can be retrieved centrally, this should be done if possible. For example, Google Analytics can be used for the number of website visitors. Furthermore, if possible, data should always be extracted automatically without manual intermediate steps. Data from Salesforce, for example, can be sent to a central route via an API without permanently tying up human resources. Here, the setup is more extensive, but the costs for this are already equalised after a few months. In addition, data quality and data availability are increased. If data still has to be transmitted via Excel or CSV, exchange platforms are available that ensure that all files have the same format. In the past, web portals that have already integrated automated logic for checking data have been recommended for this purpose.
Modern self-service dashboards offer a great many customisation options
If all data is available in a central data pool, a functional report can be quickly created from the mock-up using modern self-service dashboarding solutions. The advantages of these platforms are obvious: countless possibilities to create individual presentations, granular rights management and central availability.

A good dashboard alone does not create culture change
As soon as the reports are ready, it must be defined how the application is to be integrated into everyday life. Now there is a basis for dealing with the content of the data. A responsible person should define the processes behind it: In which contexts and time periods will the dashboards be considered together? How are measures derived and the implementation of these monitored? The establishment of (lived) processes is even more important for successful use than the technical setup at the beginning.


